Well Plotter 3D
Software for 2D / 3D visualization wells and boreholes. Complex and very easy to use tool for well data analysis
and visualization in 1D log plots, 2D cross sections and 3D fence diagrams. Analyze and visualize variable data types,
such as technical scheme of well, geological scheme, numerical continuous / section / point measurements, tectonic and
structural data or images.
License: Commercial | Price: 499 €
Buy Now »
Download »
Demo »
User Manual »
White Paper »
Well Plotter 3D software was developed with effort to make the most simple-to-use tool for well & borehole data visualization in 1D / 2D / 3D space for individuals.
Its adoption is very easy and quick. You can create common visualizations in a very simple way.
Import your data to project (copy-paste from your spreadsheets or import from CSV files) and display.
Well Plotter 3D includes all the features presented for the basic Well Plotter software -
display your well data on map and in log plot. Description of these features
you can find here.
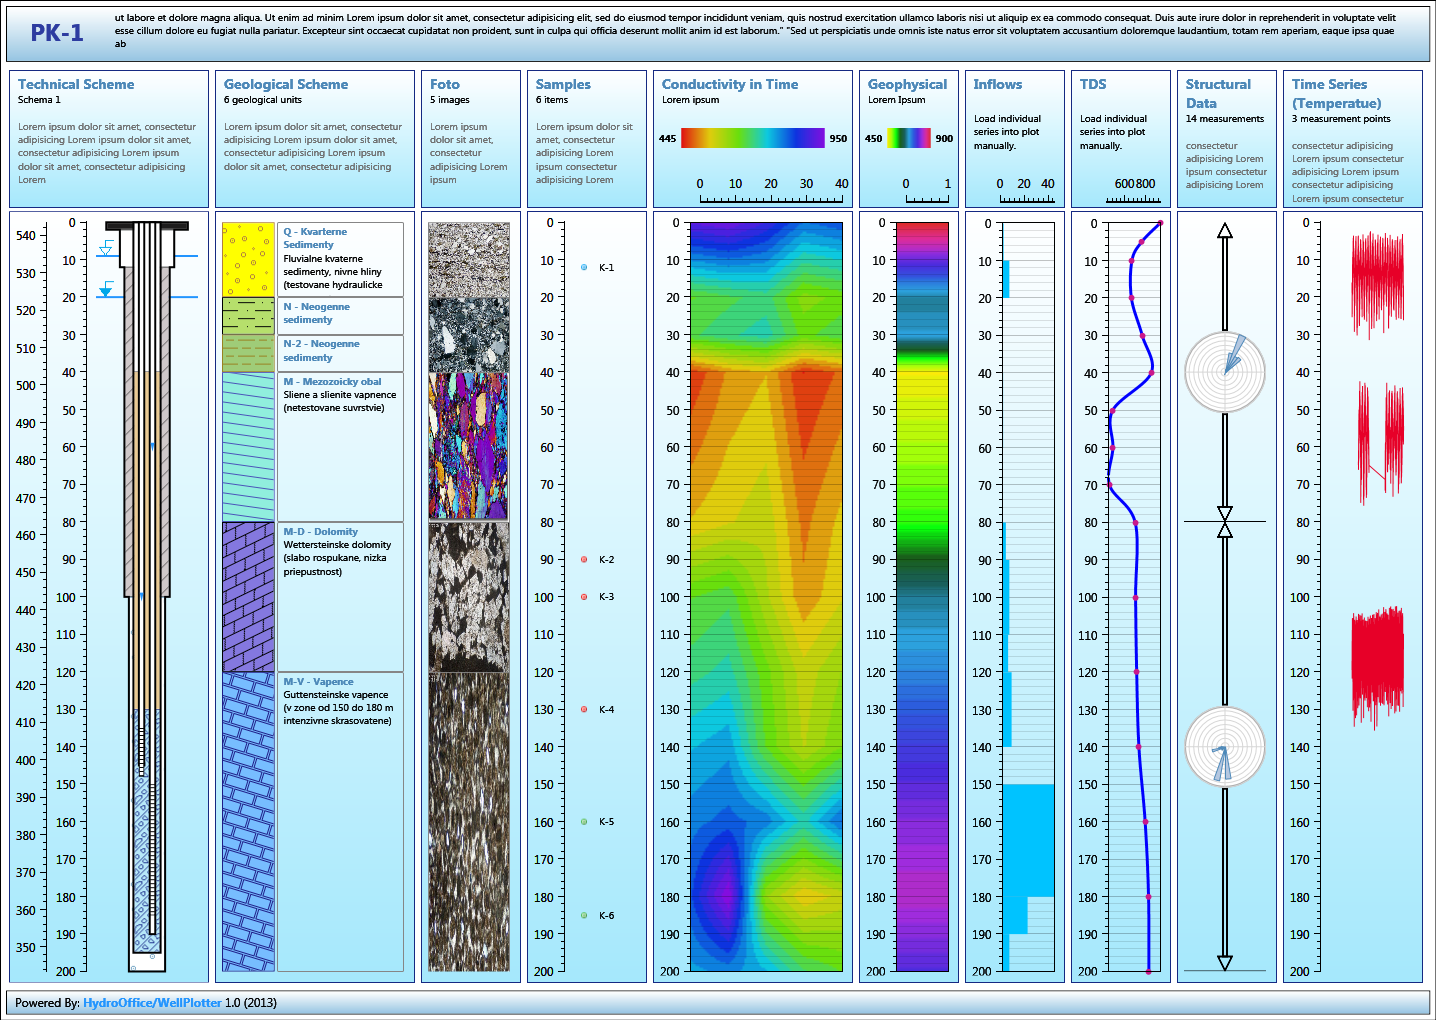
Well Plotter 3D have two additional display options. One is for 2D geological
schemes and the second for complex 3D geological fence diagrams with support of ESRI shapefiles.
In 2D you can display your results from geological or hydrogeological research in 2D cross sections.
In the places, where wells are located, you can insert other types of data visualizations, such as
technical scheme of wells or chart with your numerical measurements.
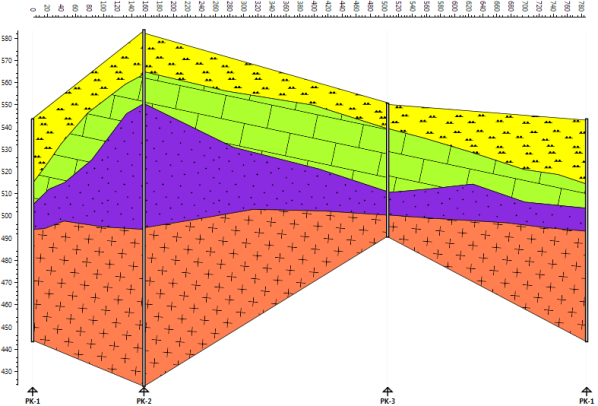
For 3D fence diagrams visualizations you can use second group of functionality.
This part include standard 3D engine. You can zoom, pan or
rotate your models; you can set-up vertical scaling of models or export result to image files.
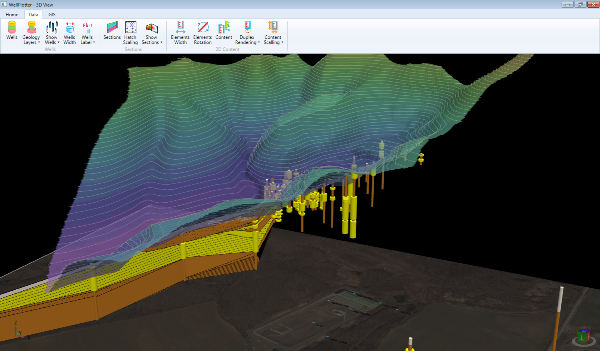
In 3D view it is possible to display wells as 3D tubes. These tubes can be displayed by
predefined color, custom color or by colors according to geological properties.
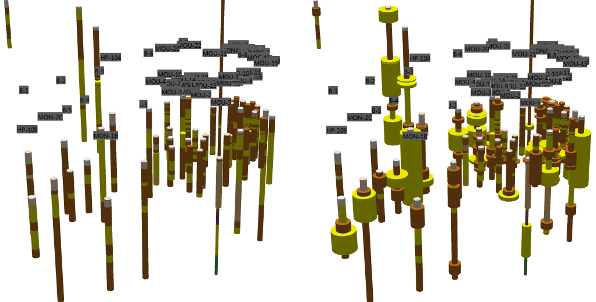
With 3D wells you can also display 2D planar geological sections between pair of wells.
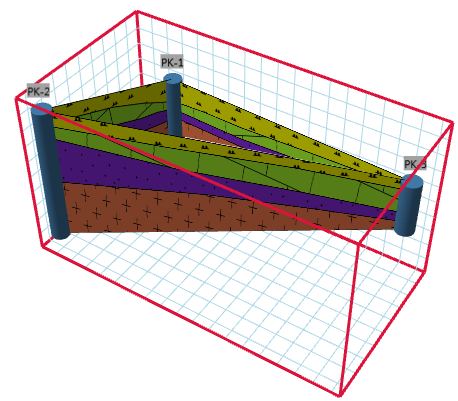
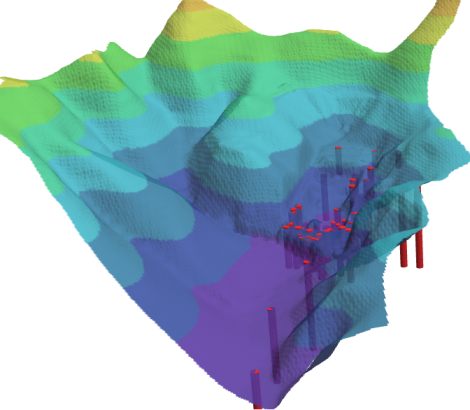
Into model you can import multiple grid layers that can represent surface of area or
groundwater level. These grid objects can be colored by solid color, color
palette in relation to altitude. Surfaces can be rendered as wire frame or you can place on this
grid selected image (such as satellite image).
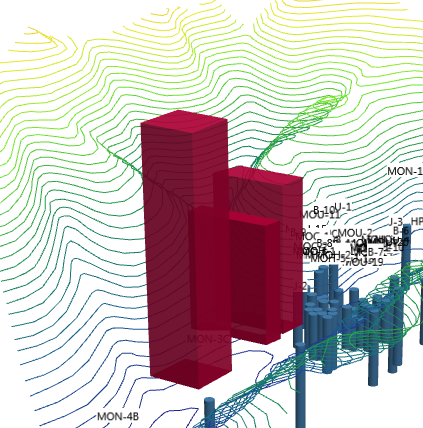
Another type of data that you can import to 3D model are ESRI ShapeFiles. These can
represent for example buildings, contour lines or other spatial objects.
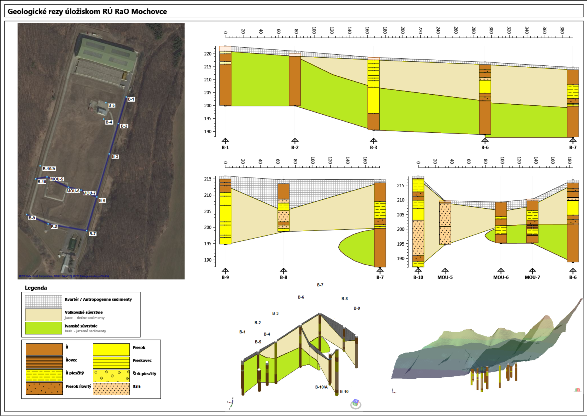
At the end, all these functions can be combined to produce one complex visualizations with all your 1D, 2D and 3D objects.
In Download section you can find a Demo version of this tool. Next information about functionality you can find in the White Paper or
in User Manual. Examples from real work you can find also in video tutorials on our YouTube channel.