Well Plotter
Data visualization software for wells and boreholes. Analyze and visualize variable data types, such as
technical scheme of well, geological scheme, numerical continuous / section / point measurements, tectonic and structural data or images.
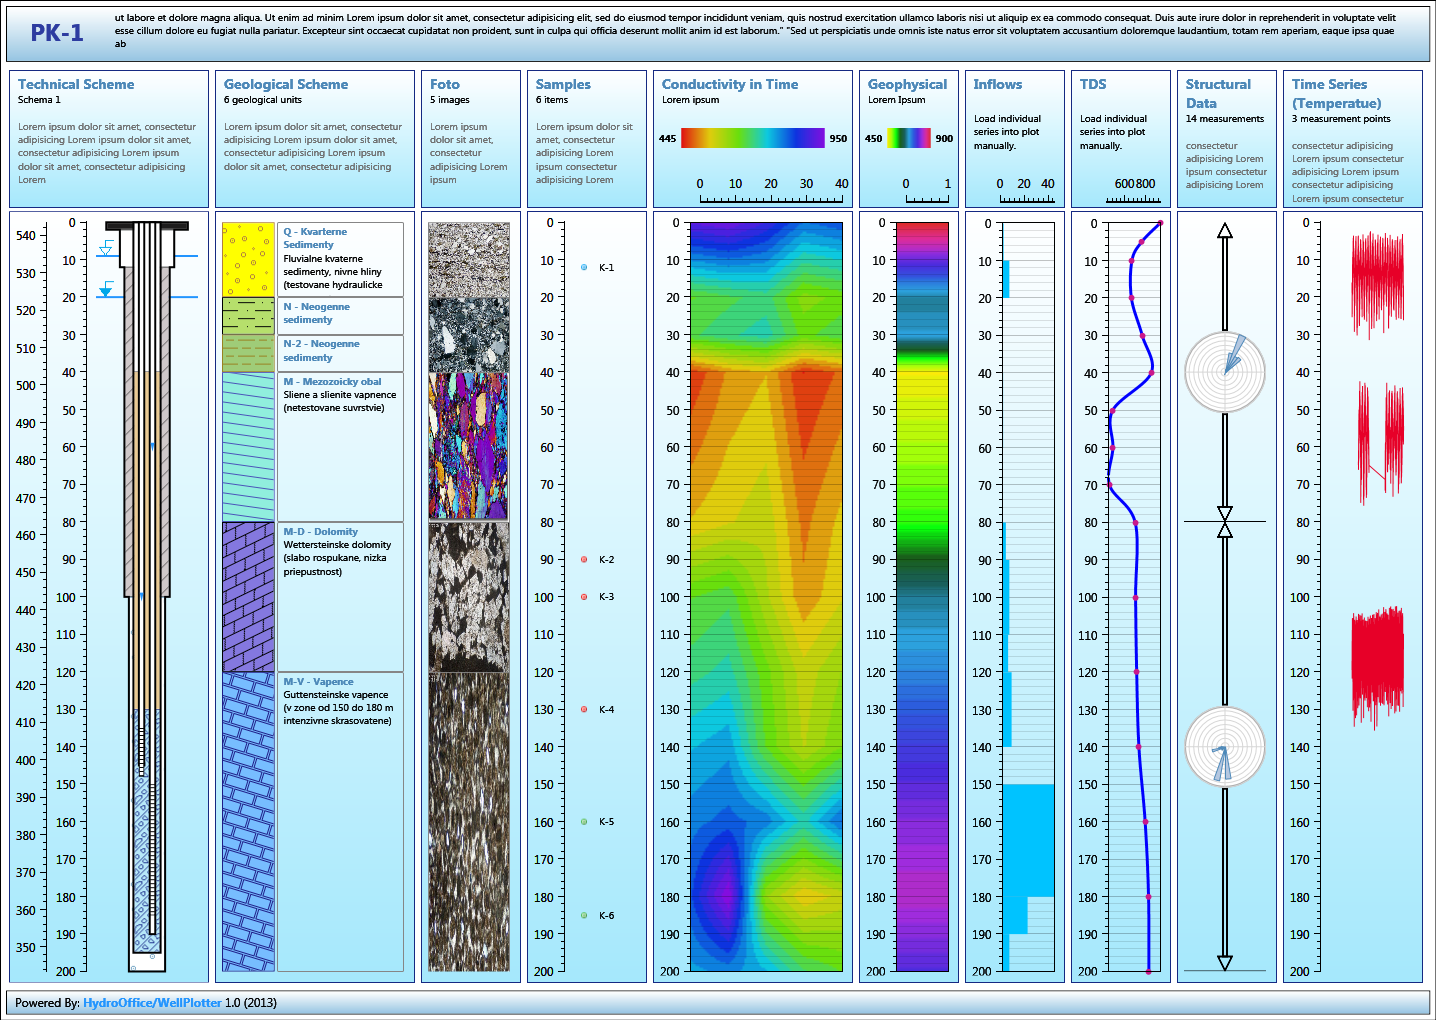
All described data can be simultaneously displayed in the log plot.
License: Commercial | Price: 299 €
Buy Now »
Download »
Demo »
User Manual »
White Paper »
Well Plotter software was developed with effort to make the most simple-to-use tool for well logs plotting for individuals.
Its adoption is very easy and quick. This tool is in the middle between classic graphical solutions (such as Corel or AutoCAD) and
complex / expensive solutions (such as WellCAD, RockWorks or LogPLot). You can create common well log visualization in a very simple way.
Import your data to project (copy-paste from your spreadsheets or import from CSV files) and display.

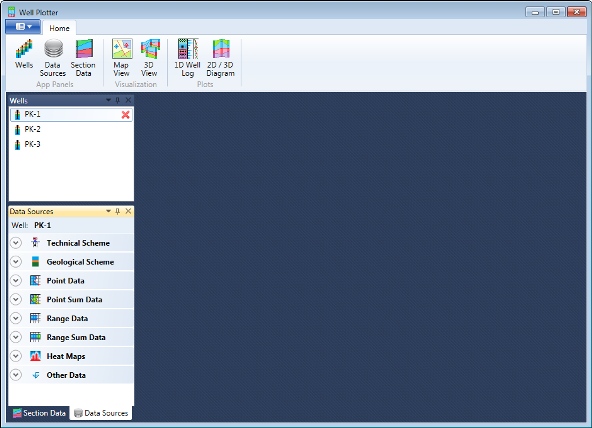
The program's user interface was designed for fast and efficient work. All the work is controlled by a ribbon toolbar
and side panels. The ribbon toolbar is reactive and always displays only the features you can use.

This program allows you to work with all variable data types. These include technical well
diagrams, geological rock descriptions, numerical measurements, tectonic data, text descriptions,
images and photos and point measurement time series at your predefined depths. Data preparation
in this program is very simple. You can create input data directly using the built-in editors, by
importing CSV files or directly from spreadsheets using “Copy-Paste”; so that all these features
greatly speed up your work.
Selected Features
Display your wells on the map.
Create complex technical scheme of your wells.
Import and setup individual geological layers.
Choose from several options for geological information display.
Apply custom edits directly on your log plot.
Structural and tectonic data.
Import point, range or continuous values.
Visualize in various forms.
Add additional data in the well profile.
Or create fully custom column in your log plot.