TS Editor
Software for hydrological, hydrogeological and meteorological time-series data processing. The flagship of the second generation
of the HydroOffice tools. Functionality of this tool is designed for simple and quick time-series processing. In the case you are working in
the field of hydrology - environmental engineering - meteorology, this tool can save you a huge amount of time.
License: Commercial | Price: 399 €
Buy Now »
Download »
Demo »
User Manual »
White Paper »
The program is generally designed to work with data sets of time series. Because of the wide
range of program’s capabilities, it can be used in many areas.
In fact, TS Editor can be used wherever you need to process the time series of measured values.
Due to the focus of HydroOffice software, its functionality is indispensable in the following areas:
- hydrology and hydro-biology
- geology, geo-technical engineering and geo-informatics
- environmental science and engineering
- water and land use management
- meteorology and climatology

TS Editor contains more than 2,000 functions for time series managing.
TS Editor is (in functionality) situated on
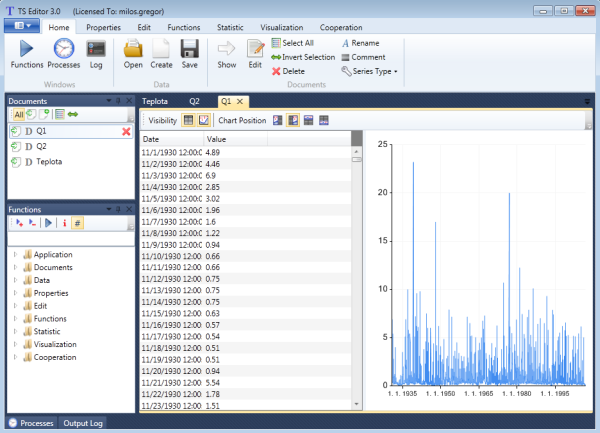
the border between spreadsheets, statistical tools, databases and visualization software. You can execute all features from
the ribbon toolbar, using the functional tree in the side panel, or with the very simple
and fast scripting language from the command line.
Analyze time series properties

This group contains functions and commands to obtain information
about the nature and structure of the time series data sets. With these commands you
can get the time series metadata, such as:
- the number of values in the time series
- the number of zero values or values in a defined range
- time ranges of selected time series
- length, character and the number of gaps in the series
- information on the uniformity and continuance of the time series
- characteristics of sections in the series with increasing, decreasing or constant value trends
Edit your time series datasets

The Edit group contains functions and commands for editing the series.
This group includes the most features. Using the commands in this group
you can perform the following operations:
- select or delete data on the scope time range definition; using filters, user defined conditions, the nature of the values and other methods
- recalculate the values in a series using mathematical functions
- fill gaps using several methods
- transform the time series (for example; recalculate from hourly to daily minimum time series)
- shift values in the document on the timeline
- copy the temporal structure of series (or values) between time series datasets
- combine and merge time series into a single document with variable and adjustable functions
- convert units
Apply specialized time series functions

The Functions group includes specific features that cannot be assigned to other categories.
Their use is widespread and they are particularly useful for:
- creation of single and double mass curves
- interpolation of values between two time series
- automatic merging of multiple time-series into a single table
- unification of the temporal structure of multiple time series according to the one selected
- statistical analysis and visualization of multiple time series in the profile (for example; time series depending on depth below the surface, or altitude)
Execute statistical calculations on time series

Statistical parameters for the selected
series can be calculated using these commands. TS Editor allows you
to calculate the minimum, maximum, average, sum and count of values.
This information can be obtained for the entire time series, for individual
years, months, seasons and inter-annual periods.
In addition, the program allows you to create statistical reports which can be used directly in your reports or articles.
Visualize your time series data

TS Editor allows you to create many types of time series charts.
You can visualize all types of time series and their individual settings / parameters can be
freely changed.
Many independent features have been created in the program for specific
visualization types. For example, these functions allow you to show various
graphs, such as range charts, summary charts, graphs of annual courses or
graphs of rainfall-runoff relationships. In addition to the
described functions, the program allows you to visualize
sections of your time series which are mutually temporally synchronized.
Cooperate

The last group of commands lets you work with external programs / file structures.
The current version allows you to work with the Feflow time series files.
This cooperation allows prepared time series to be exported from the program in a *.pow file (specific for this program).
In addition, your results from Feflow can be directly opened and used in TS Editor. You can also work with CSV files with
variable character / structure. CSV files are frequently used by external programs and data-loggers.