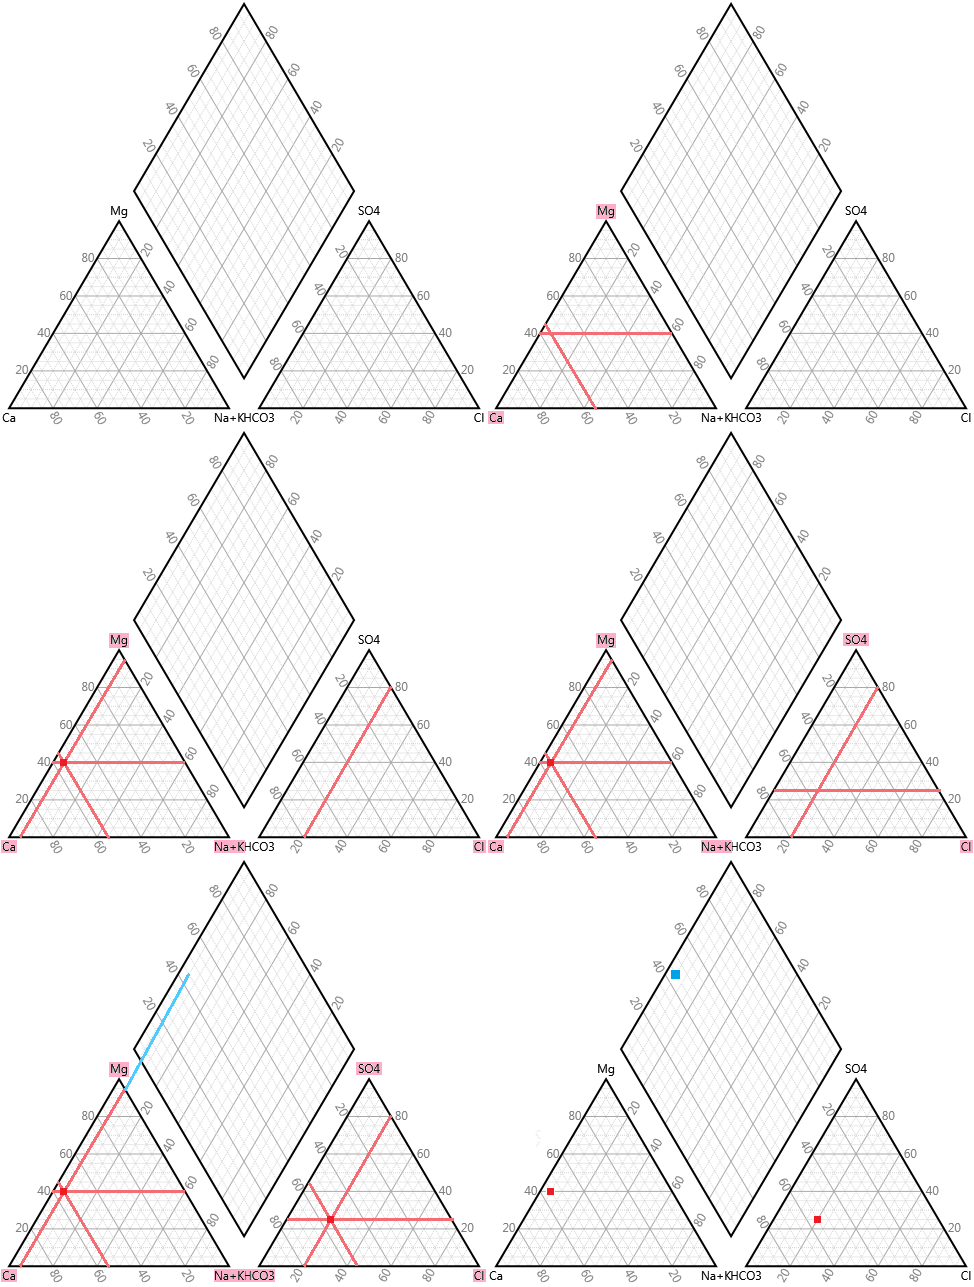
There are number of software tools for Piper diagram. Some of them are free and others are charged. Often, Piper diagram plotting is available as one of the many features in a large software packages. In HydroOffice, you can create Piper diagram in a separate, independent, installable tool, called Piper 2.0.
Most implementations of Piper diagram are relatively simple. There are two ternary diagrams, one is for cations and the other one for anions. Above them, in the middle, is trapezoid. If we have rendered point in triangles, crossing its extended axes provides a new point, which approximately defines the genetic type of groundwater. For example, groundwater from carbonate rocks is concentrated in the left corner of trapezoid.

This is a basic type of Piper diagram. In addition, several variations were created, such as type of diagram, where upper trapezoid is transformed into a square and is displayed in the middle between two ternary diagrams.
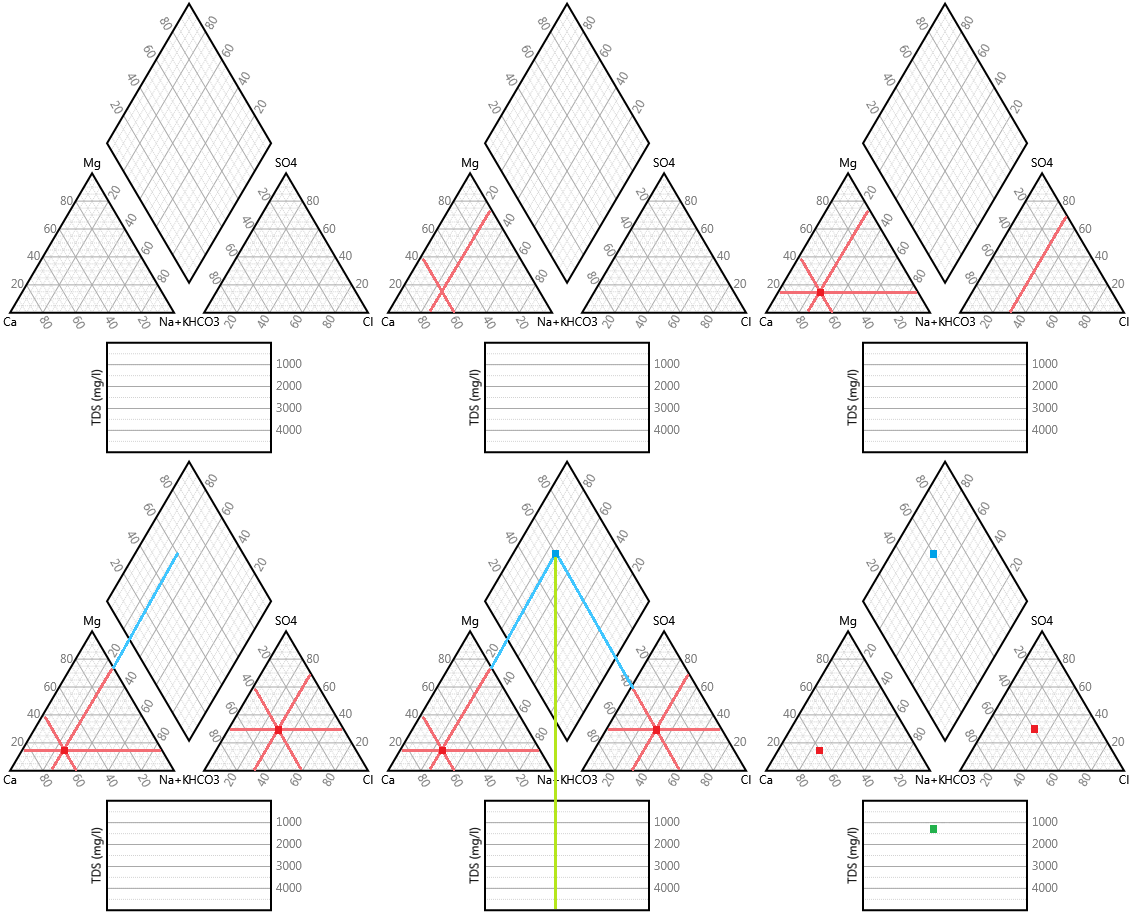
In most cases, these transformations don´t add new options (value). But there is one possibility to extend Piper diagram in one area of square shape. In this case, new rectangle is inserted below the classic Piper diagram. Its width is equal to the width of the trapezoid and its height can be variable.

This type of Piper diagram is not frequently used (indicating by the Google Search). In CE region we use this modification often (mainly for display TDS or temperature). In this way, you can visualize another parameter from groundwater chemical analysis. Practical experience shows that this is better way for TDS displaying in large datasets than in the established way, by changing the point size in the top segment of the diagram.
This Piper diagram extension is also available in the software Piper 2.0. You can choose between the basic and extended form of Piper diagram.
Note: Besides the Piper 2.0, options of diagram extension provide also the Durov 1.0 tool.