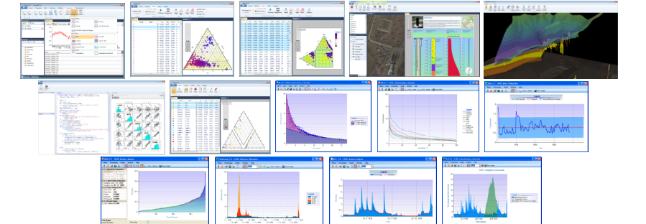
HydroOffice Features

HydroOffice includes 17 independent installable tools and each of them is focused to selected area of interest. From the general point of view you can use HydroOffice for:
- evaluation and analysis of extreme water conditions in drought and flood (TLM)
- production of flow duration curves (FDC)
- calculation of minimum and maximum N-daily values from time-series (AMn)
- baseflow separation using 11 methods (BFI+)
- recession curves analysis (RC)
- runoff components separation from discharge using the results of recession curve analysis (FlowComp)
- calculation of long-term average groundwater runoff from catchments (Kille)
- time series analysis, editing, processing, visualization, evaluation and export (TS Editor)
- data visualization in geochemical diagrams (Piper, Durov and Ternary)
- well logs plotting (Well Plotter)
- geological schemes (2D) and fence diagrams (3D) drawing (Well Plotter 3D)
- Excel spreadsheet data cleaning and processing (Reshape.XL)
- processing and visualizing of spatial data directly in Excel (GIS.XL & Map.XL)
- professional data import > data wrangling > data visualization (Stagraph)
Generally, the HydroOffice package includes thousands of functions that can be combined and used at your daily work.
For features description, look at the list of available tools.
A general overview brings the following video.